Welcome to DEA documentation!
What is DEA?
DEA is a content creation platform that allows users to create interactive data stories without writing a line of code.

Users can combine the data from DEA portfolio with their own assets to share engaging visualizations with the community in a simple way. With DEA, users can:
Explore and visualize datasets hosted on the platform on global or local scale, as time series, terrains and plots.
Explore the public stories available on the service in addition to their own stories.
Combine the datasets hosted on the platform with their own data, adding also text images and plots.
Share their stories with the community.
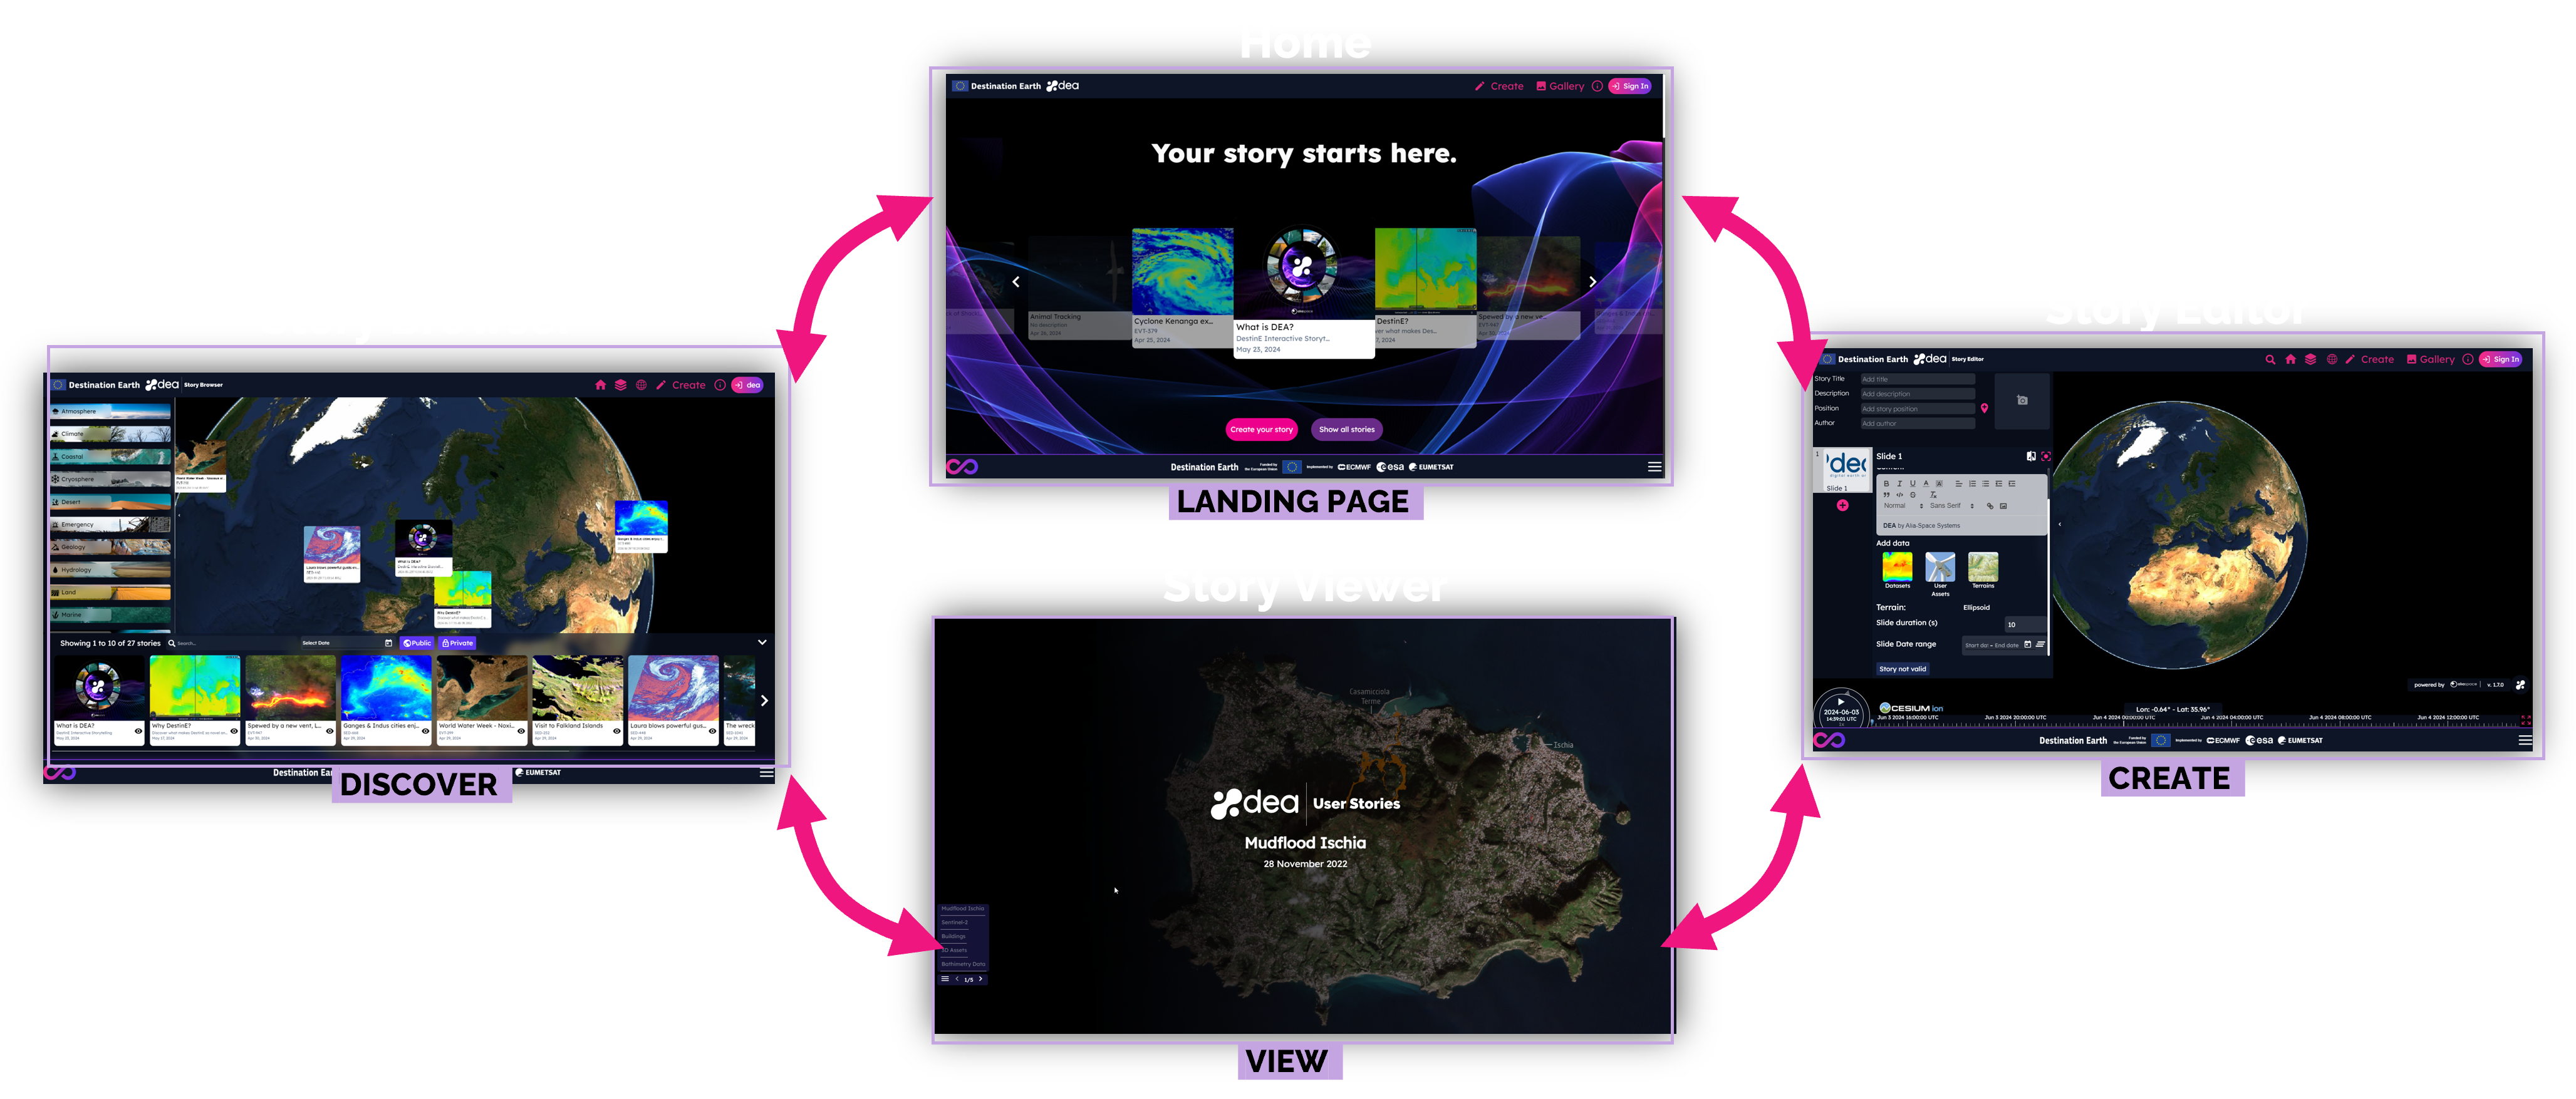
DEA Components
DEA is made by different components
The Story Browser, which contains the list of the public and users’ stories, filtered by categories and properties, shown also as interactive placeholders on the globe.
The Story Editor, which allows users to explore data hosted on DEA, add it on the 3D globe and create stories combining rich text and data, grouped in slides.
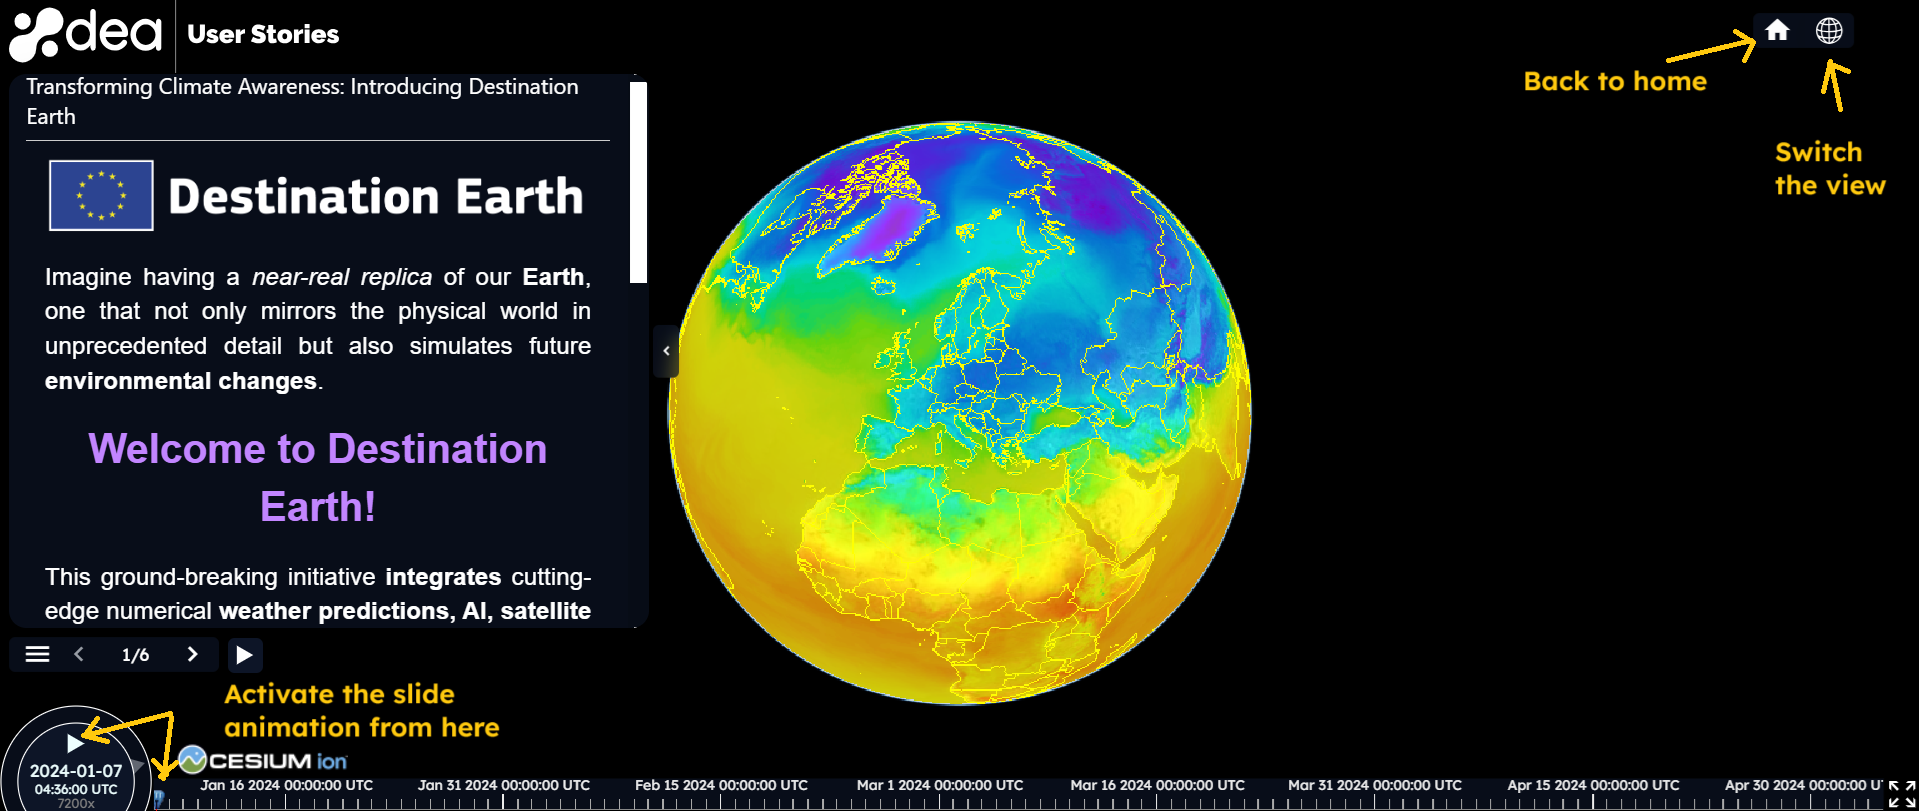
The Story Viewer, which contains the story details as an interactive slideshow showing time-dynamic data. Users can navigate the slides through arrows icons or menu, they can explore the scene of each slide, performing zoom-in and zoom-out on the 3D map and reading the rich text provided for each slide.
All this components are accessible through the DEA home page.
How to search stories
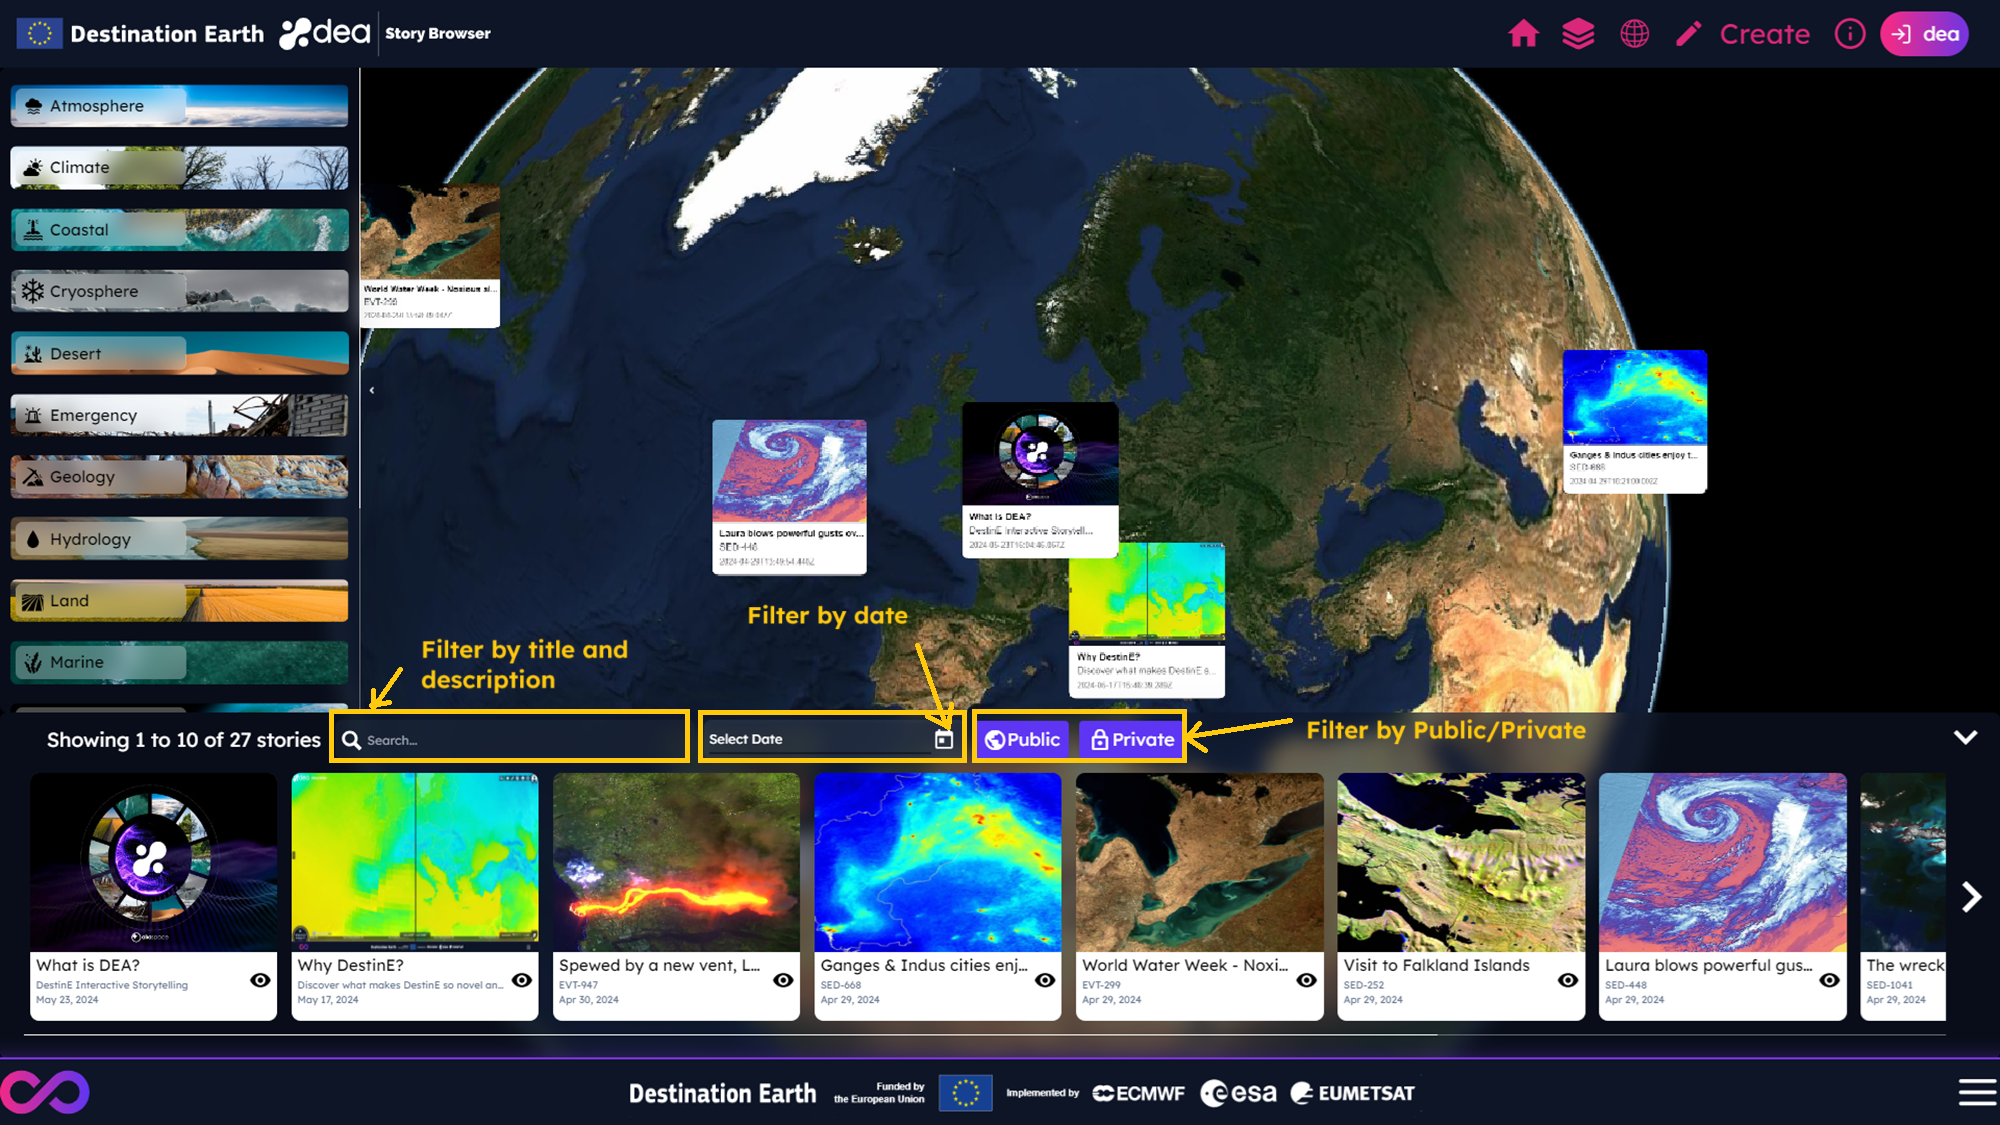
In the DEA Story Browser, you can filter the stories by categories by selecting one or more items from the list as shown in the picture below.
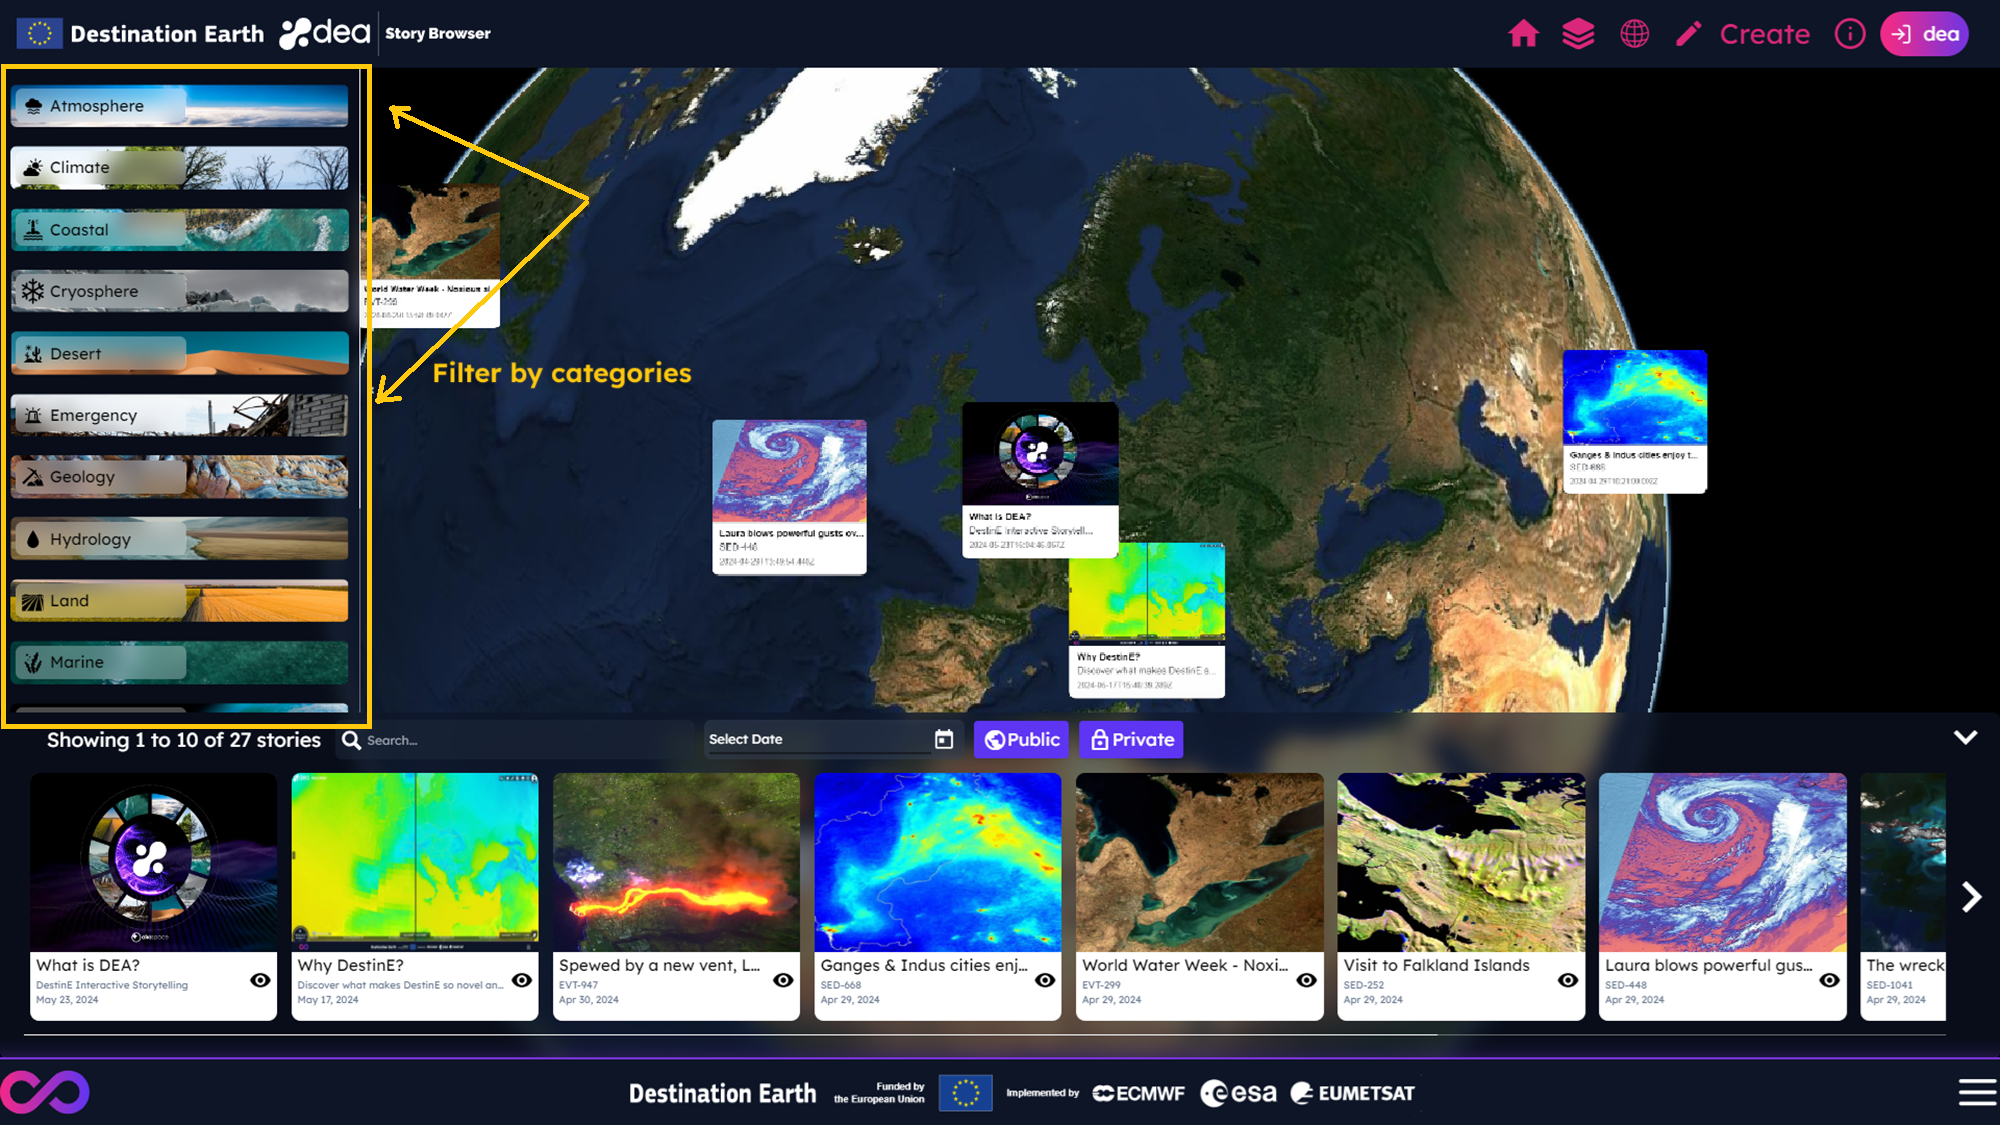
You can also filter the stories by:
title or subtitle, by adding a text in the proper search bar.
creation date, by selecting a range date from the date picker.
ownership, by clicking on Public and/or Private button to see, respectively, only public stories or your own stories.
How to visualize stories
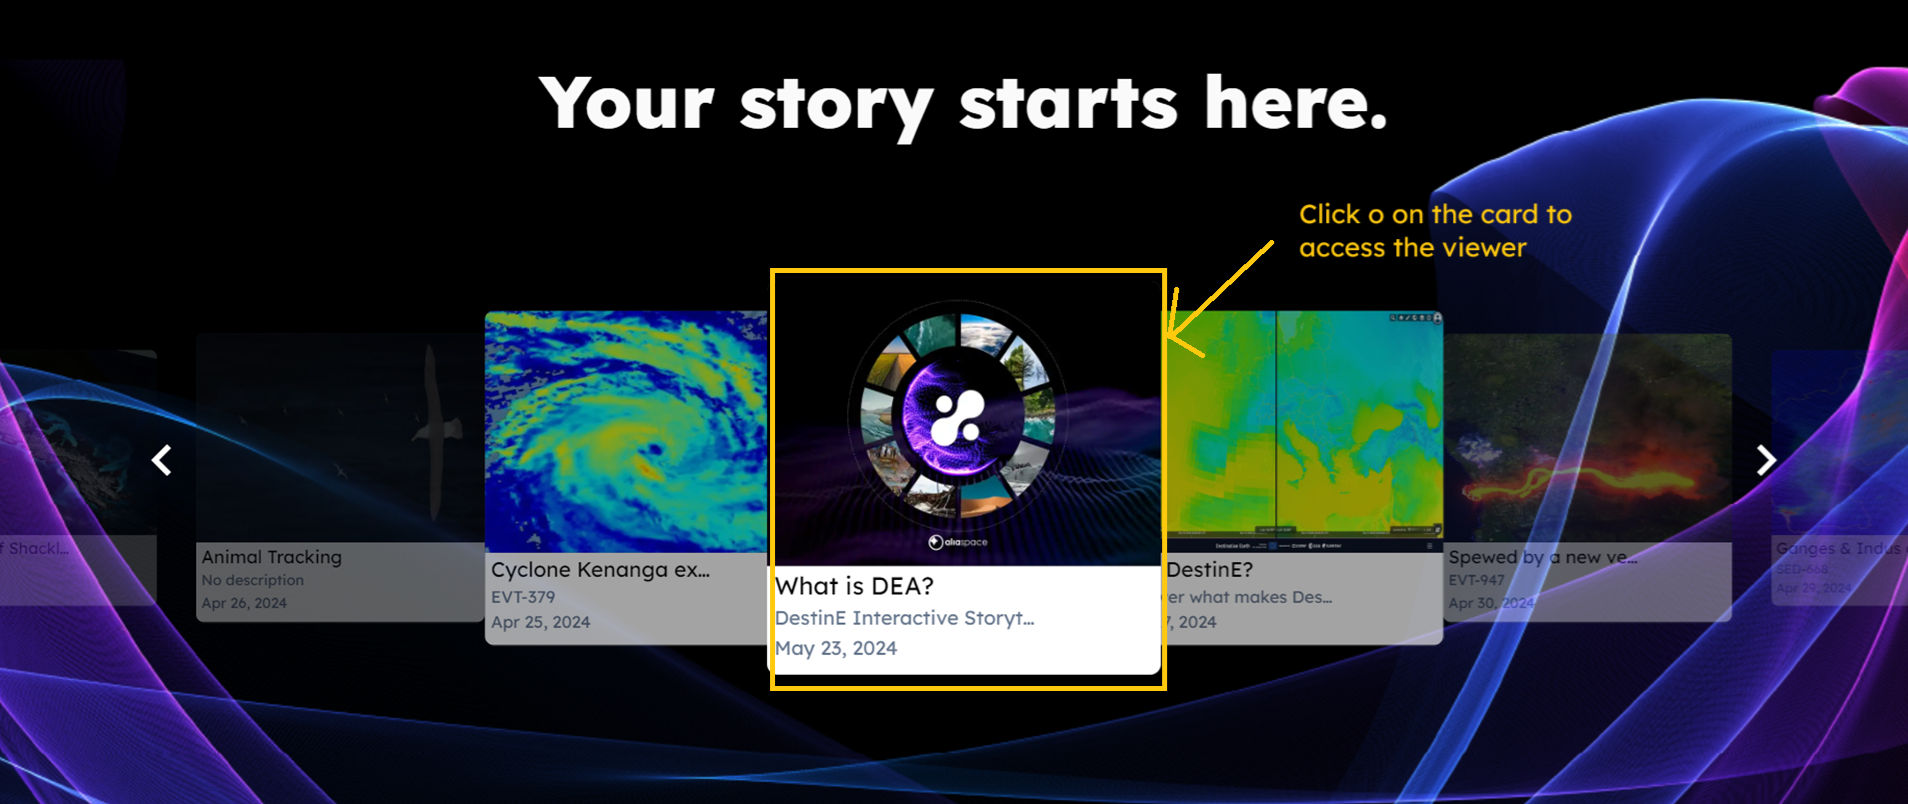
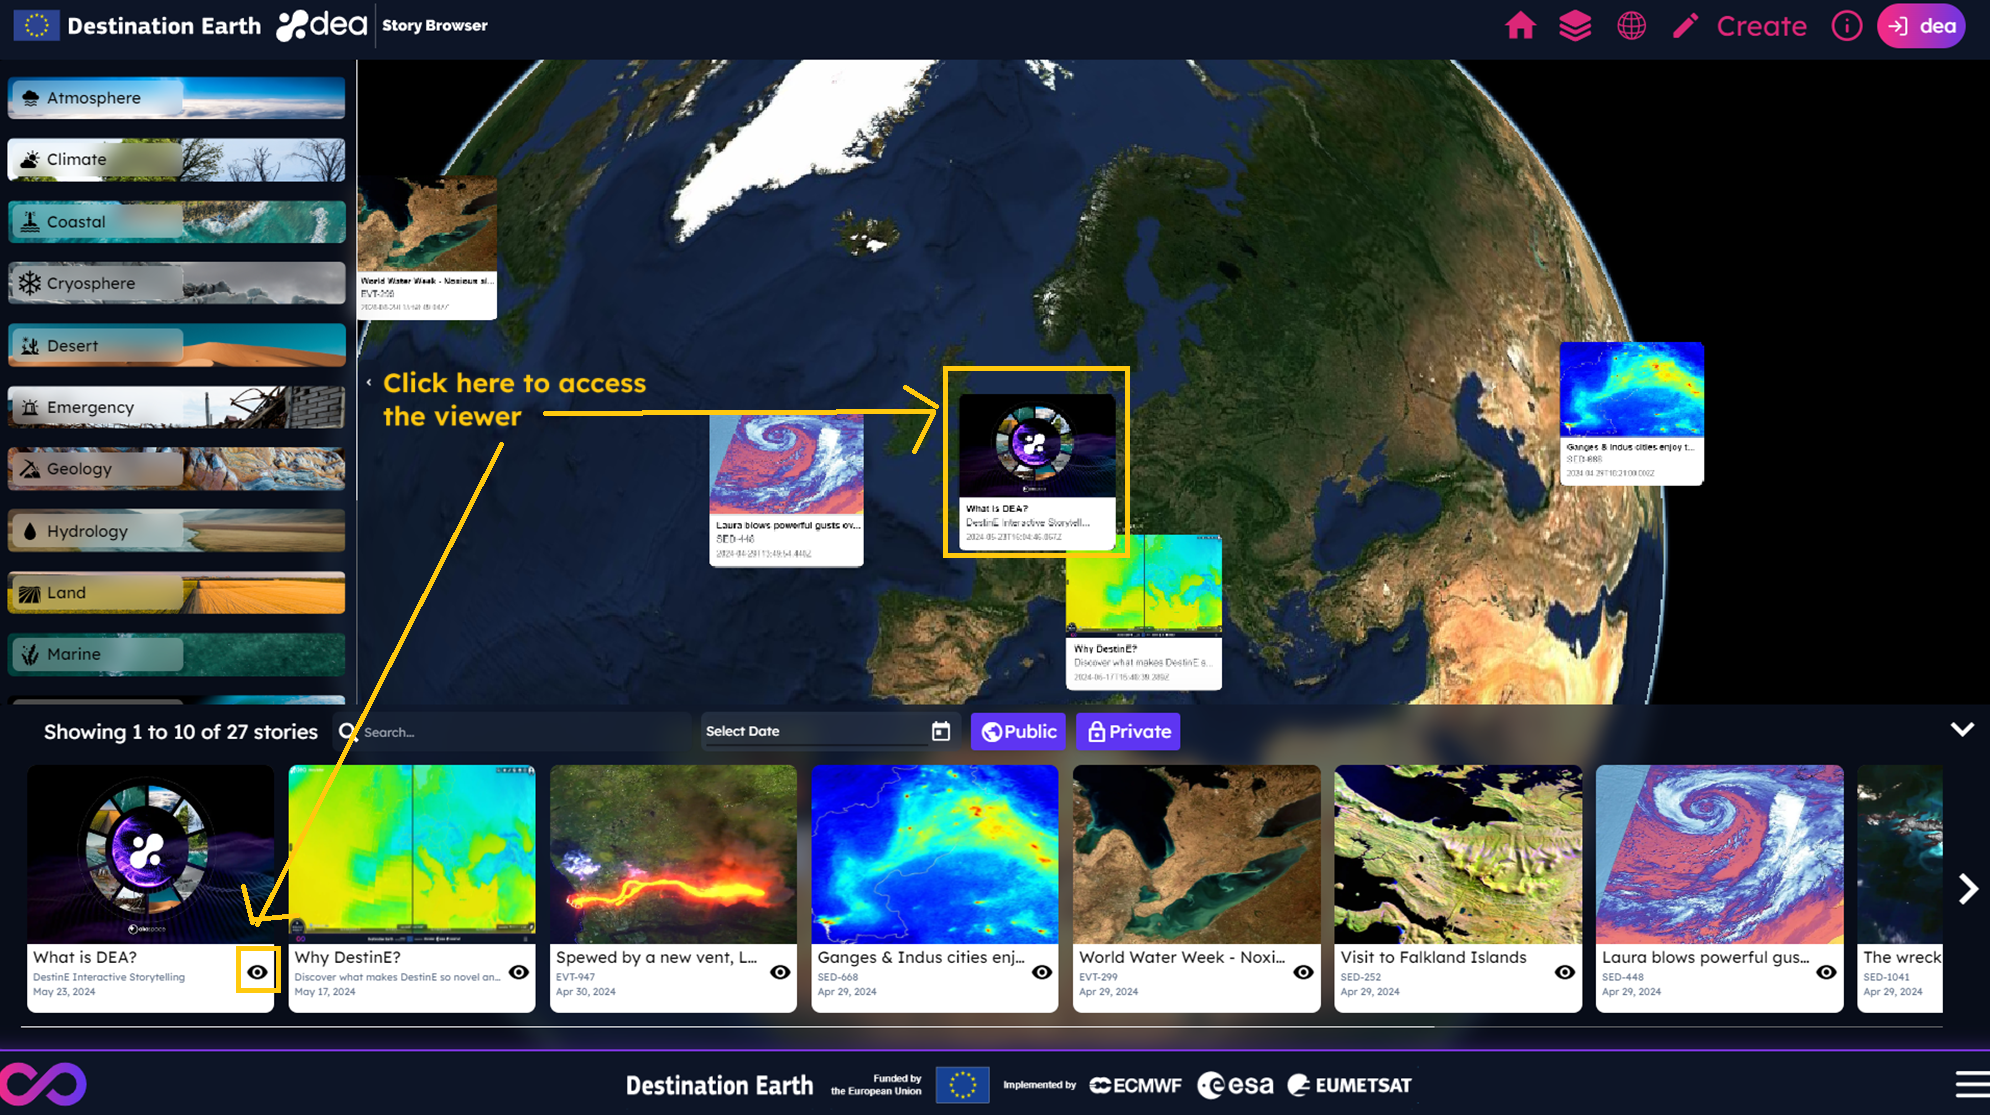
You can access the Story Viewer in the following ways:
From the DEA Home page, by clicking on a story from the gallery preview.
From the Story Browser, by clicking on the eye icon shown in the story item or by clicking on the story placeholder on the map.
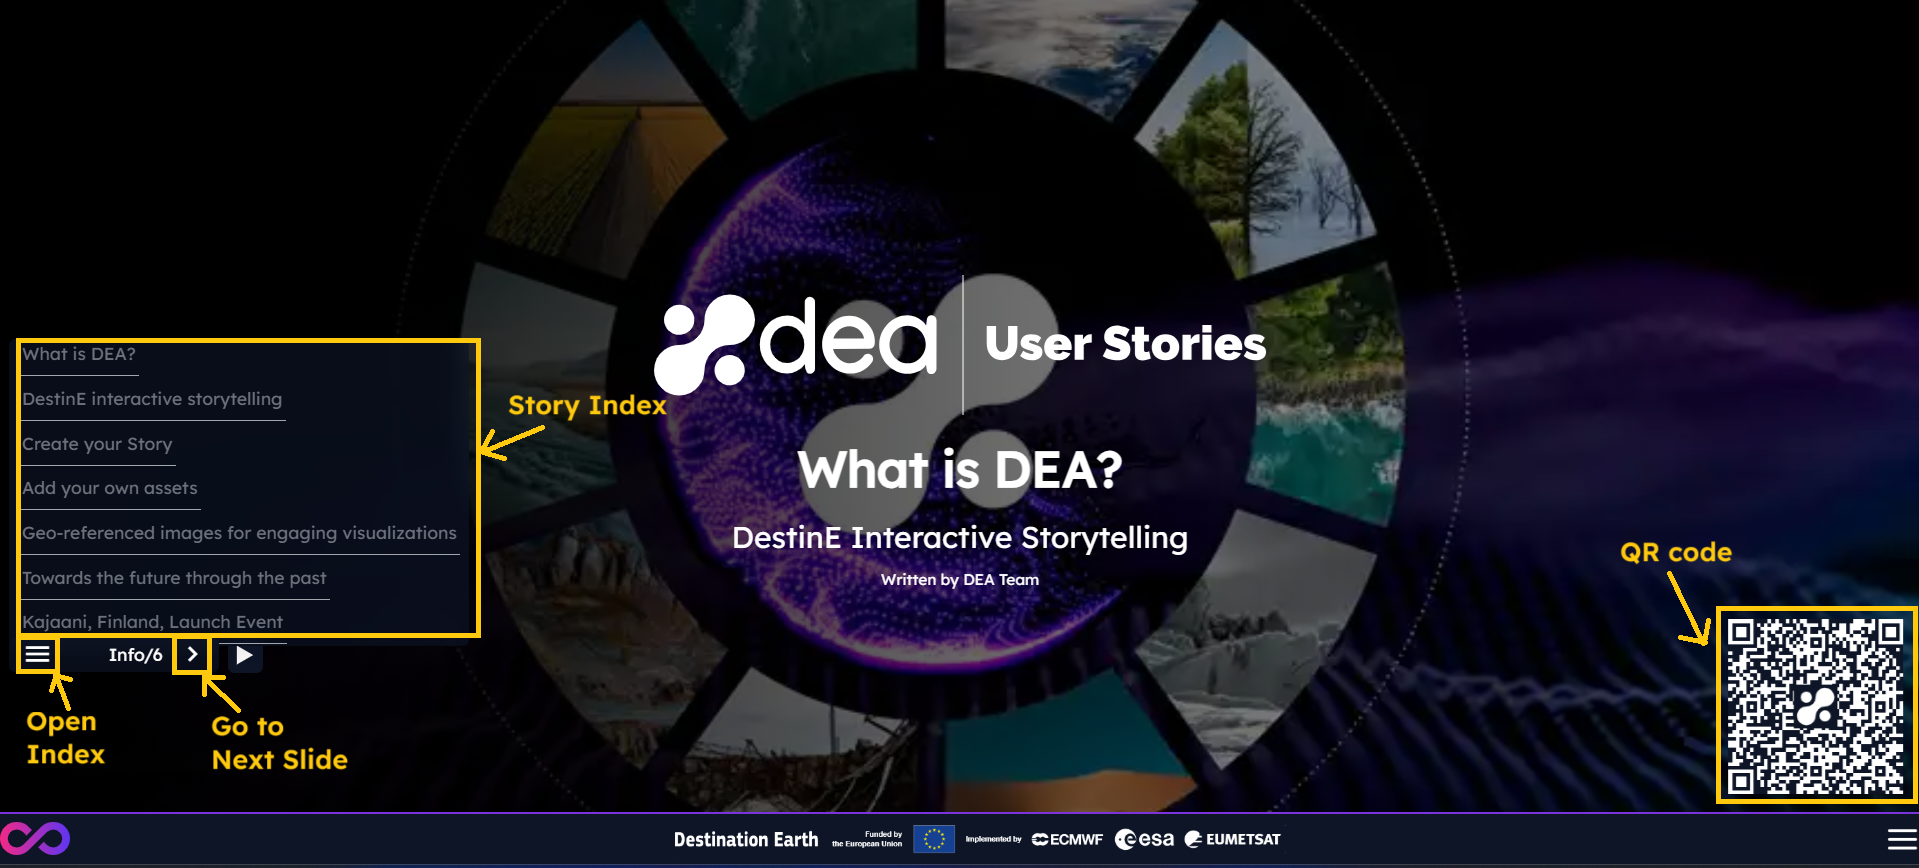
Use the indication shown in the pictures below to interact with the DEA Story Viewer.
How to create a story
You can create stories exploring the DEA data portfolio with the DEA Story Editor, which includes an editing section on the left and a visualization section, the world map, in the middle of the screen.
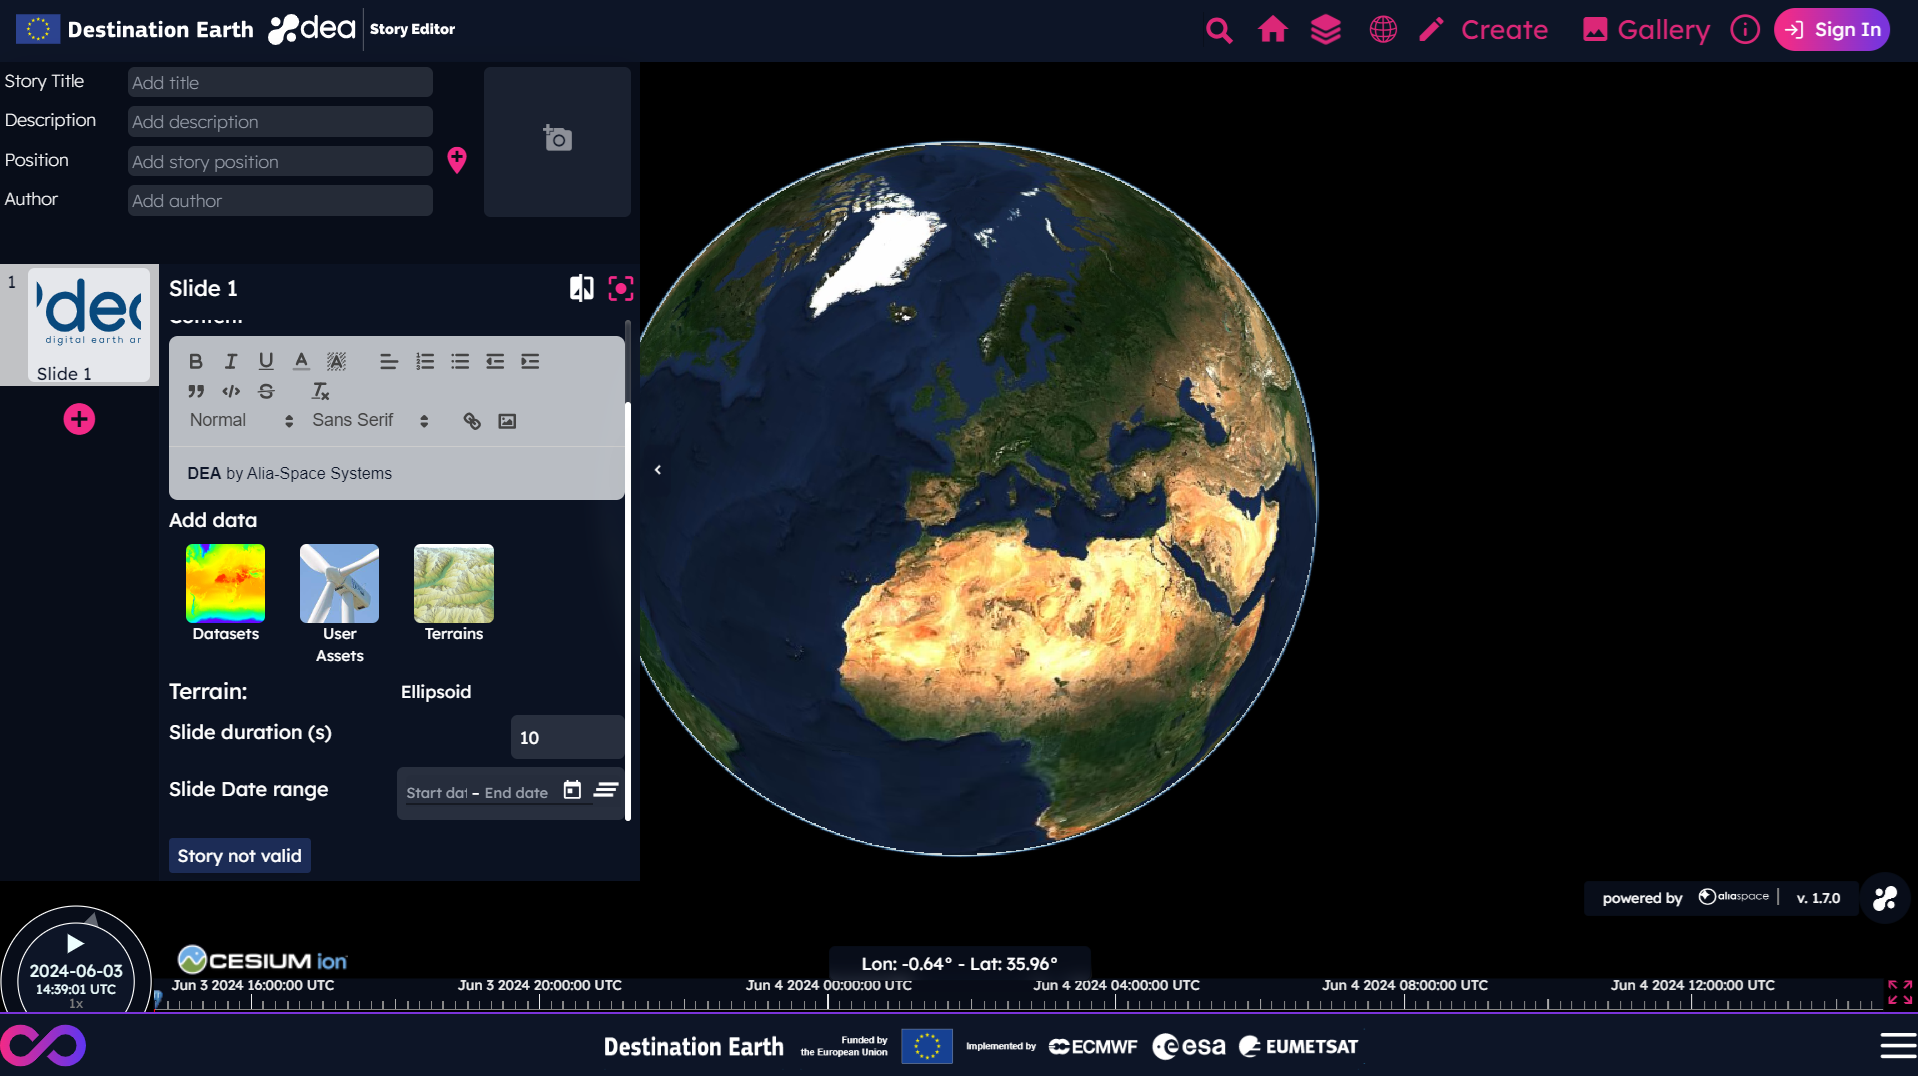
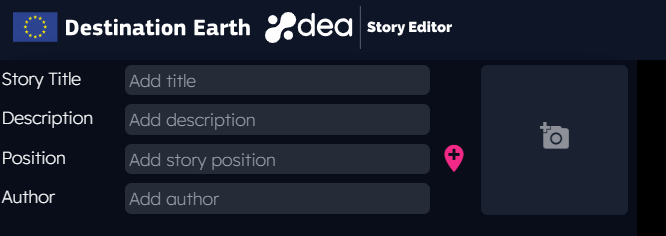
First of all, you can define:
a story title
a story description
a location, by clicking on the proper icon on the right of the text box and then selecting a point on the map
an author
a cover
Add data from DEA portfolio
Then, you can start adding data to your story, for instance, selecting it from DEA portfolio. The list of available data is shown by clicking on the Dataset image indicated in the picture below.
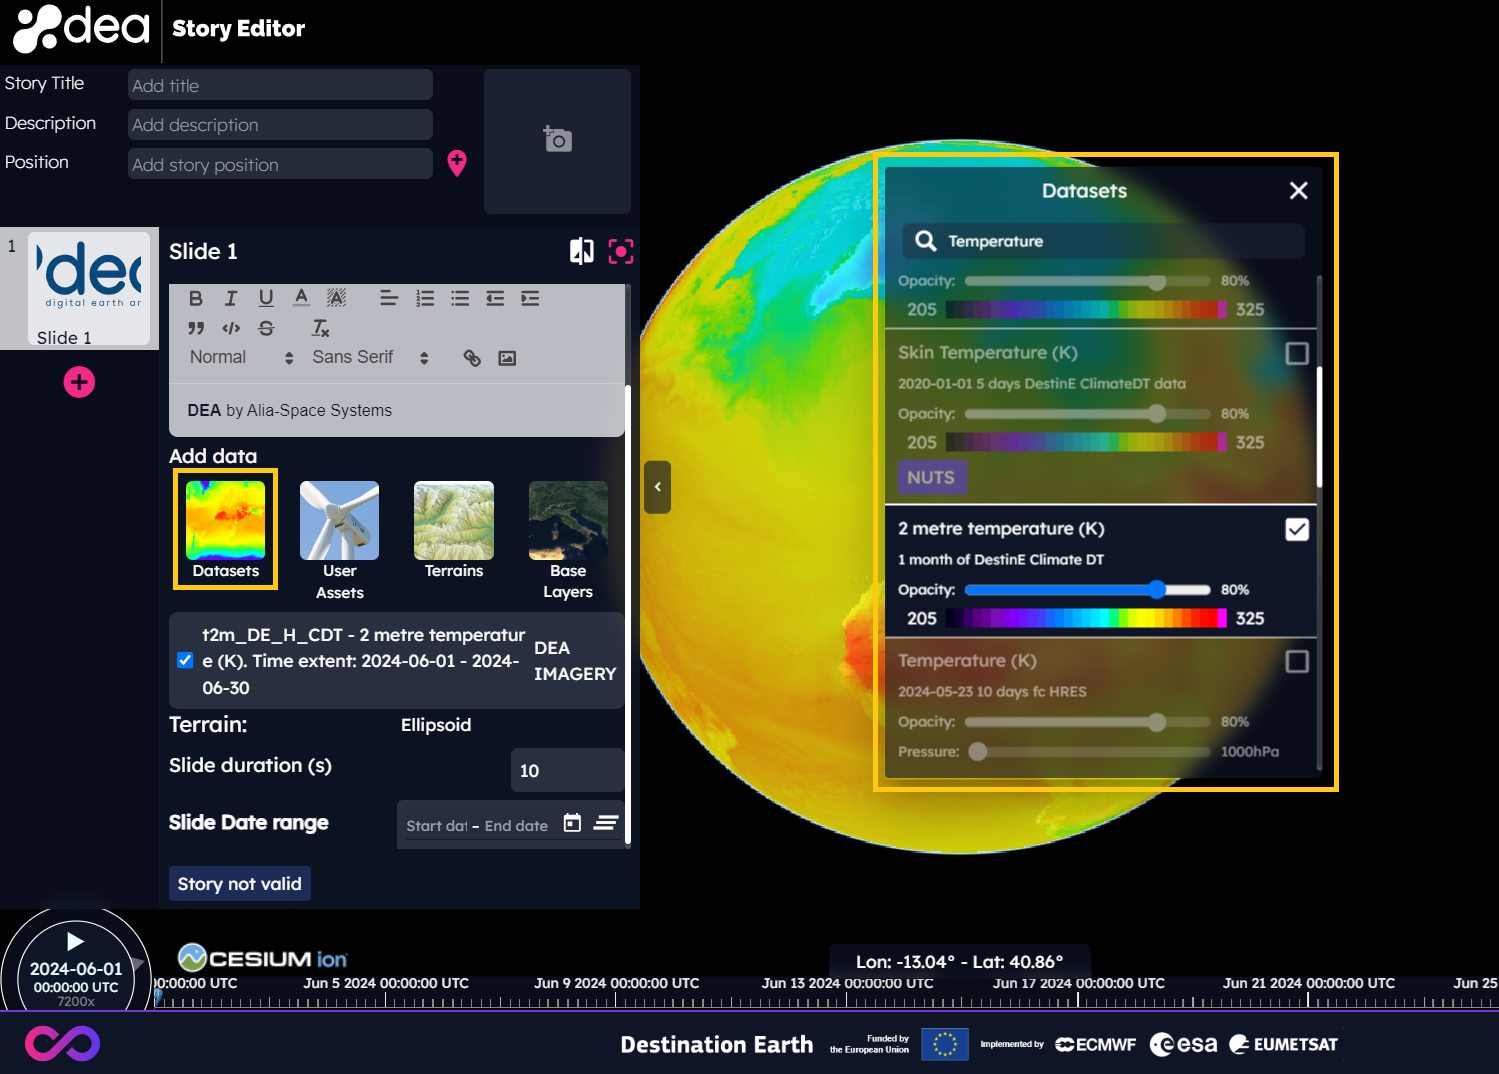
Clicking on an item, the corresponding data is visualized on the map.
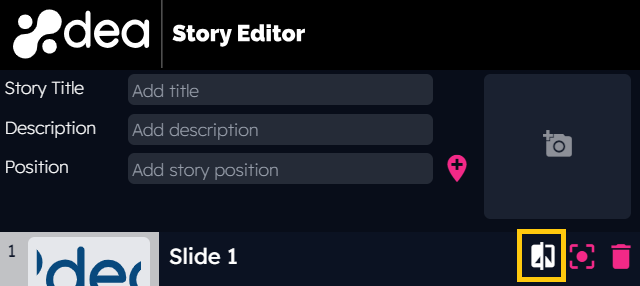
You can compare different data by clicking on the dedicated icon on the rich text editor and then moving the split line that appears on the screen.
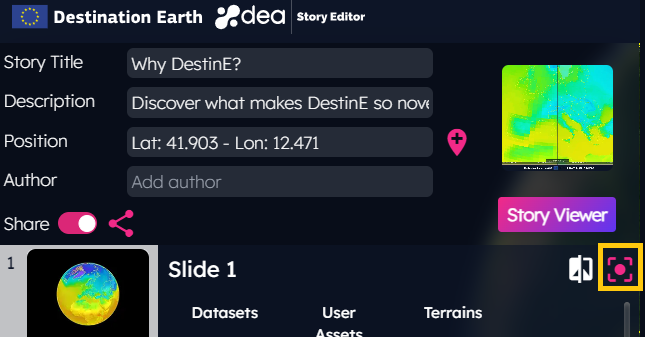
You can capture the slide view by clicking on the proper icon on the rich text editor, as shown in the picture below.
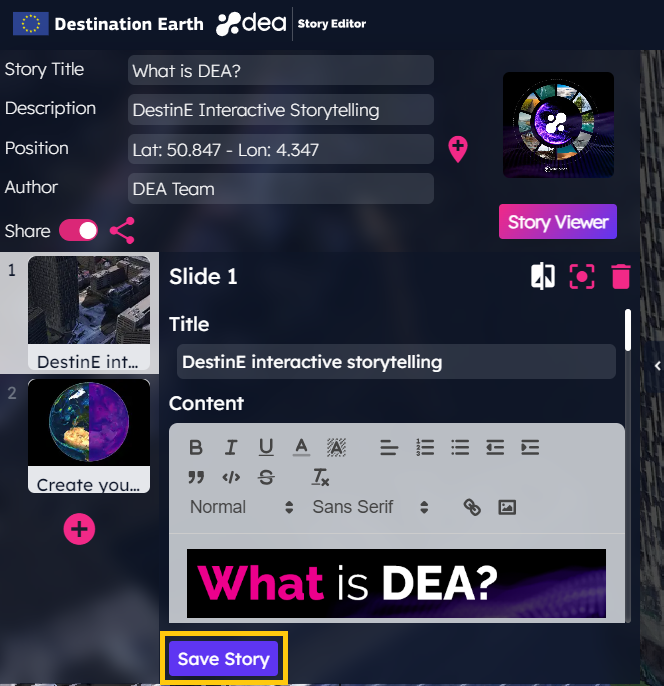
At this point, you can already save your story, by clicking on the Save Story button in the bottom of the editing section.
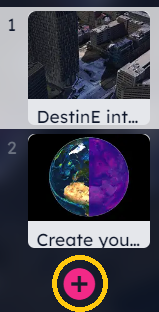
To add more slide to your story, you can click on the “+” icon located after the last slide preview of your story.
Add your own assets
You can integrate the DEA data portfolio with your own assets, stored on a private workspace of the DestinE Platform.
Clicking on the user asset button available in the DEA Story Editor, the list of your assets is shown.
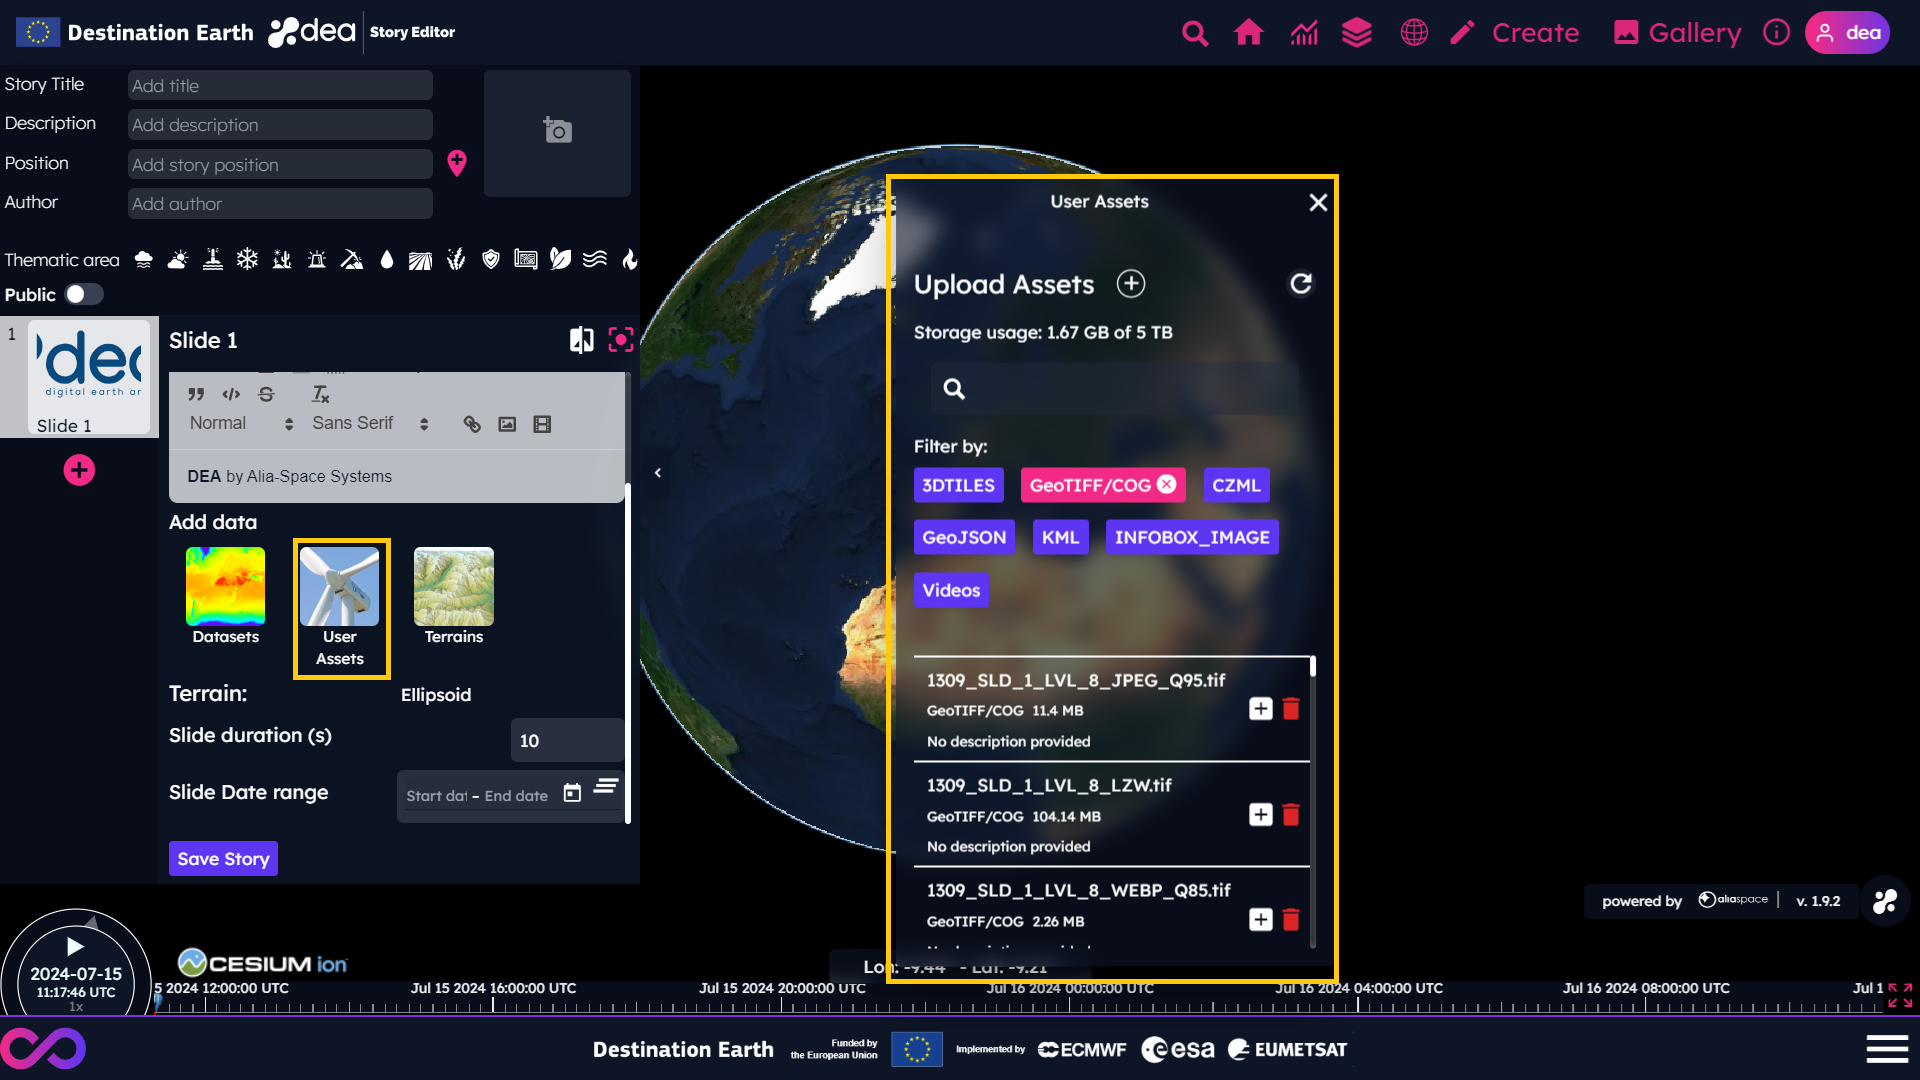
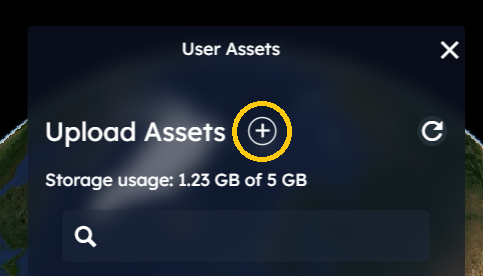
You can upload your assets by clicking on the “+” icon of the assets panel. The type of supported assets is shown in the filter section of the Assets panel.
Visualize plots
Do you want to see how a measure will evolve over time? Try DEA plots! You can exploit this feature by selecting a measure of interest from the dataset panel and then by clicking on a location on the map.
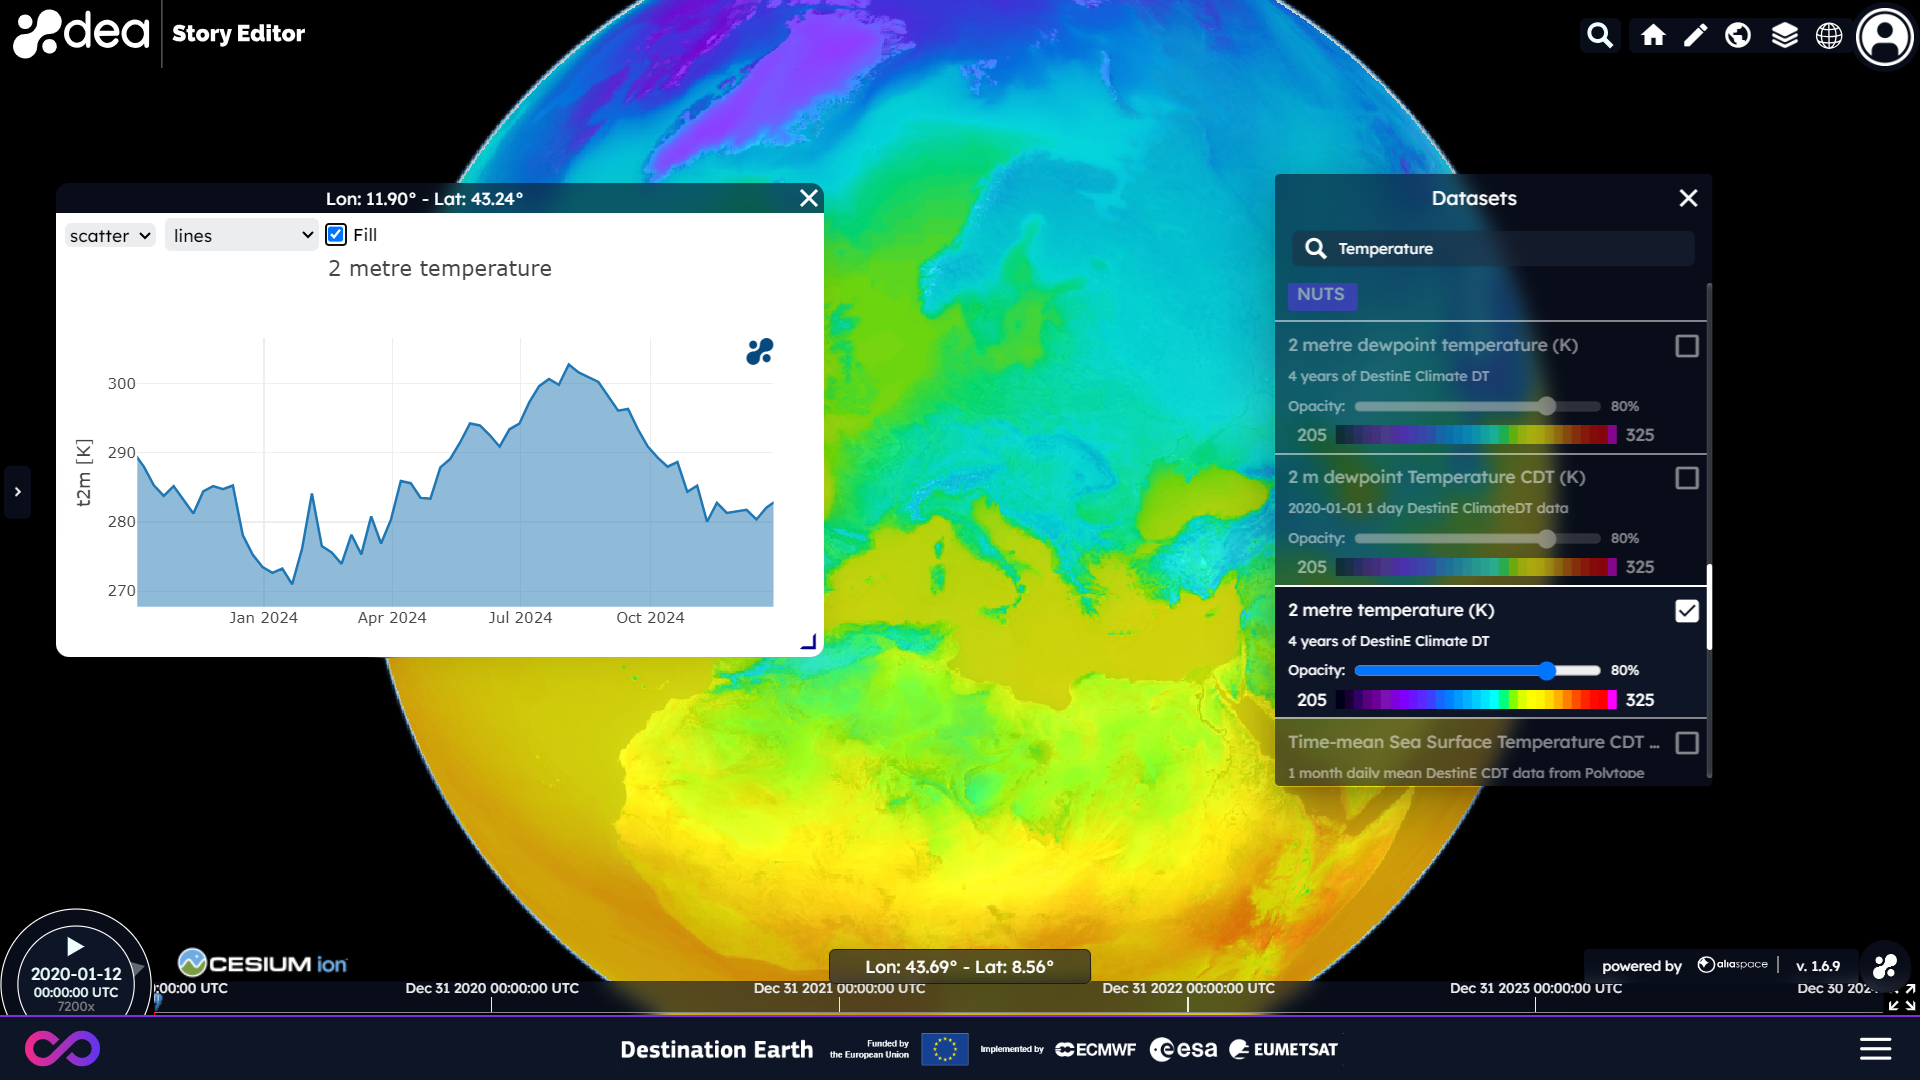
The plots can be added in the rich text editor and visualized in the textual session of the story or, if you know how to deal with KML, you can add them as markups on the map (See here as an example of KML editor online).
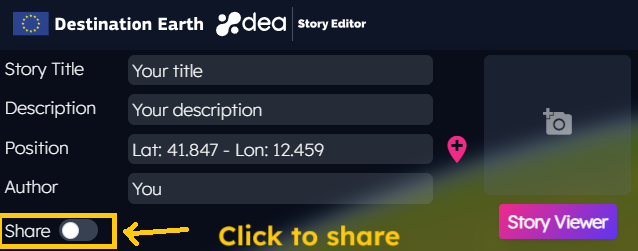
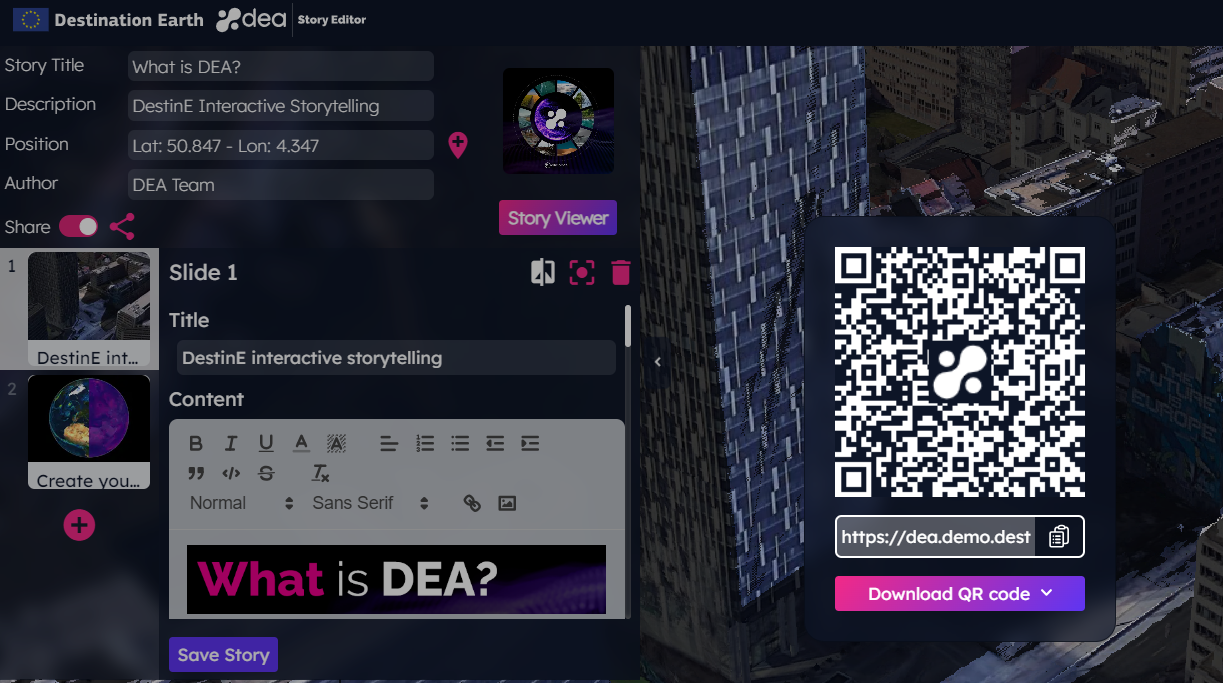
Share your story
As priority service, you can share your story with the community, by clicking on the Share button on the DEA Story Editor.
Save your story again and click on the share icon to visualize the QR code generated for your story or to copy the link of the Story Viewer that you can use on social media.
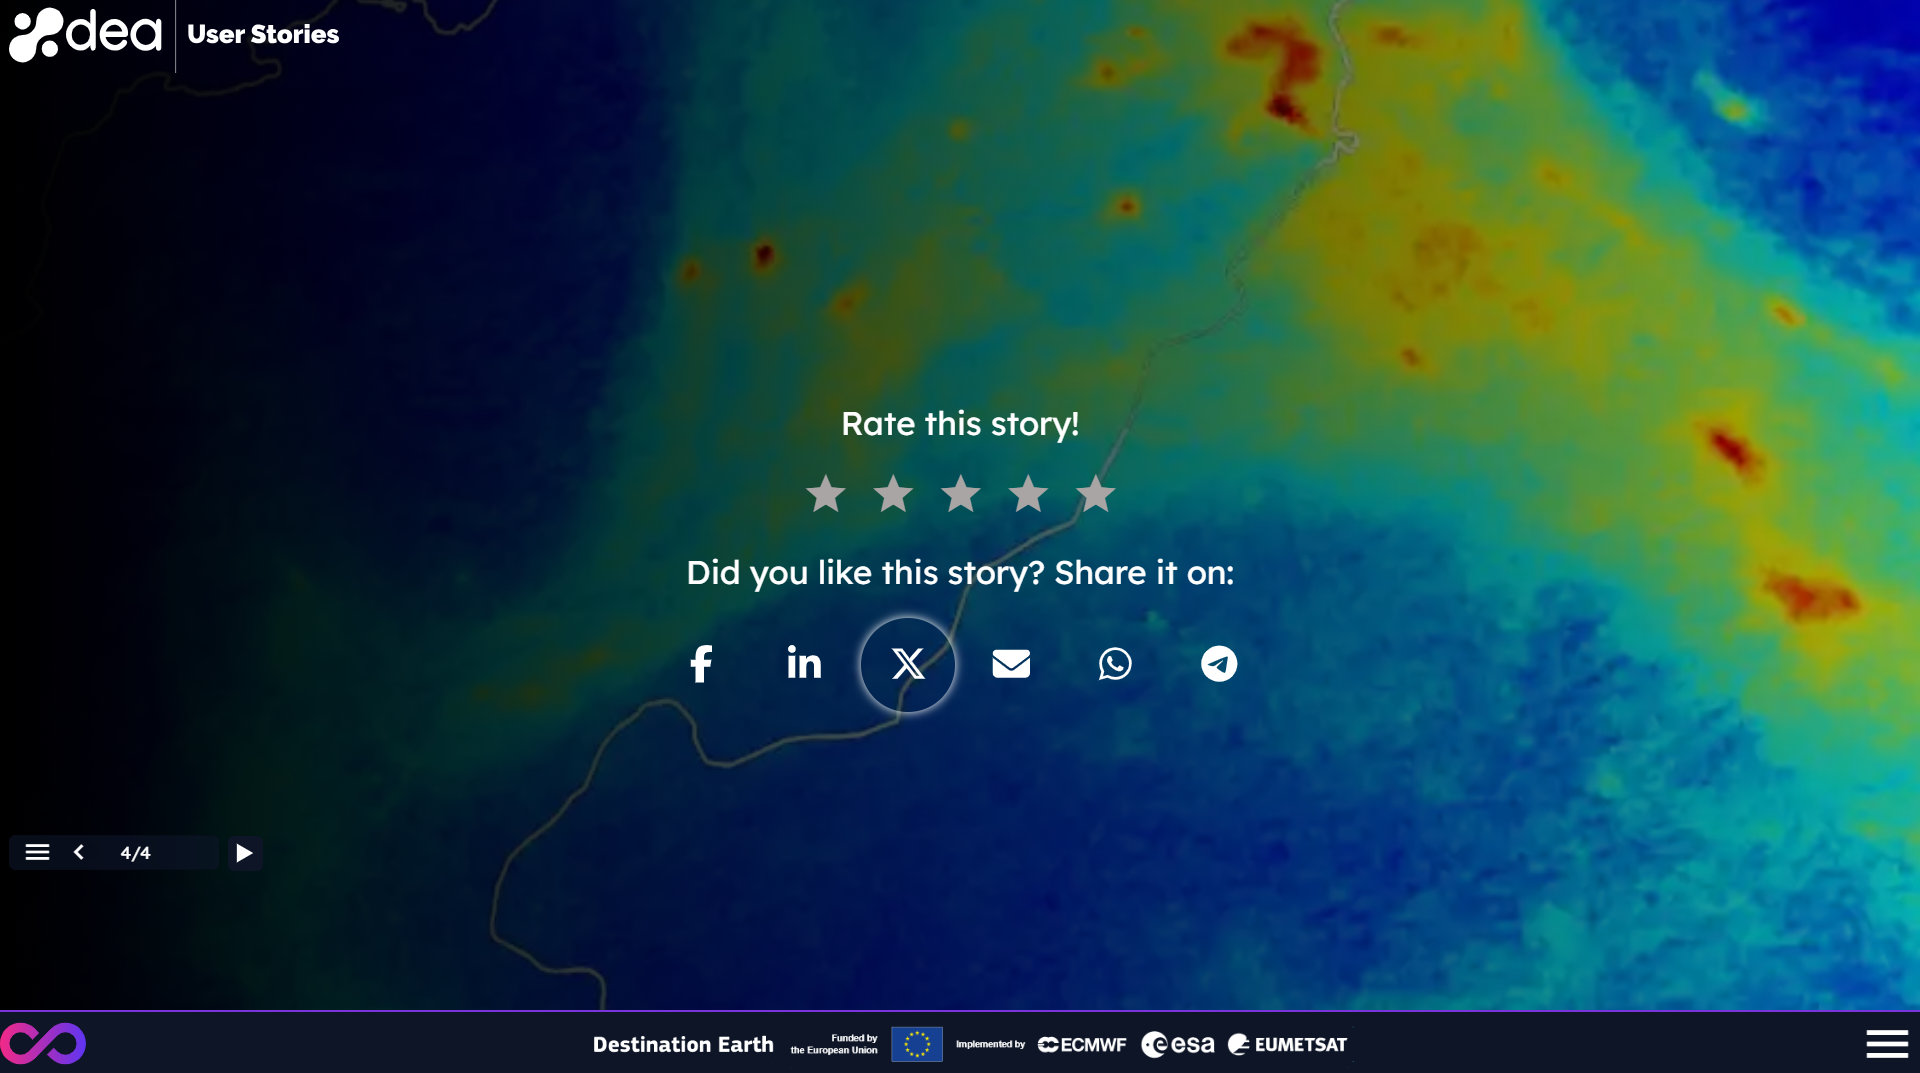
The links to share a story on the most popular social media are reported in the last slide of the Story Viewer for shared and public stories, together with the possibility to rate them.
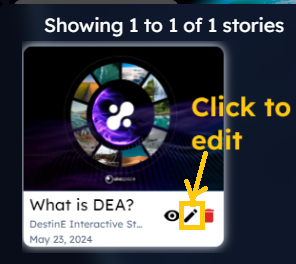
Edit your story
Do you need to edit your story? Click on the edit icon visualized on the story item preview of the Story Browser.